Compression in ParaView Geometry Delivery[]
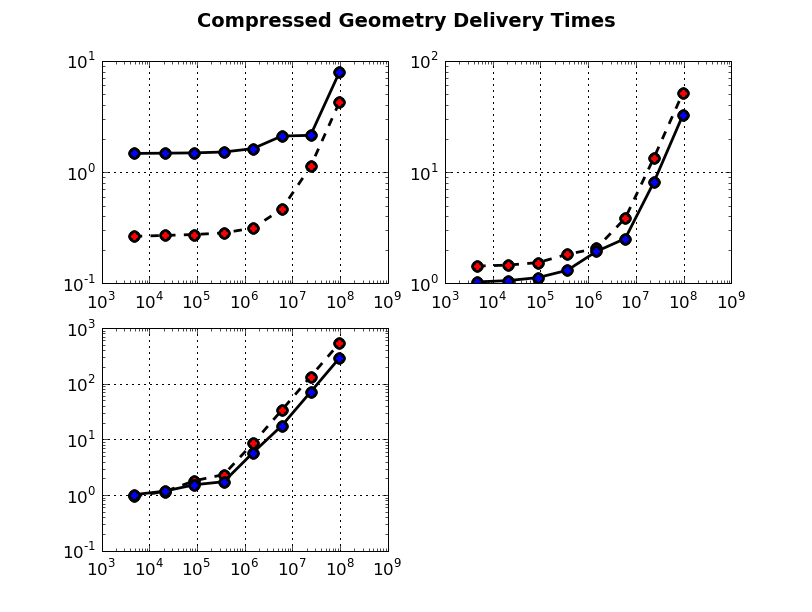
The following figure shows delivery time measured in seconds vs. geometry size measured in bytes. Red dots represent no compression while blue dots represent Zlib compression. In clockwise from upper left results obtained over 3 connections are shown, 1) localhost, 2) 100 MB/s, 3) Broadband. The test data was generated using the Sphere Source and increasing the theta and phi resolution by powers of two. A ParaView state file was used to save the test data and can be used to reproduce the results. Note: the plot is log-log so it's not that easy to read, but see the figure where we plot speed up below.
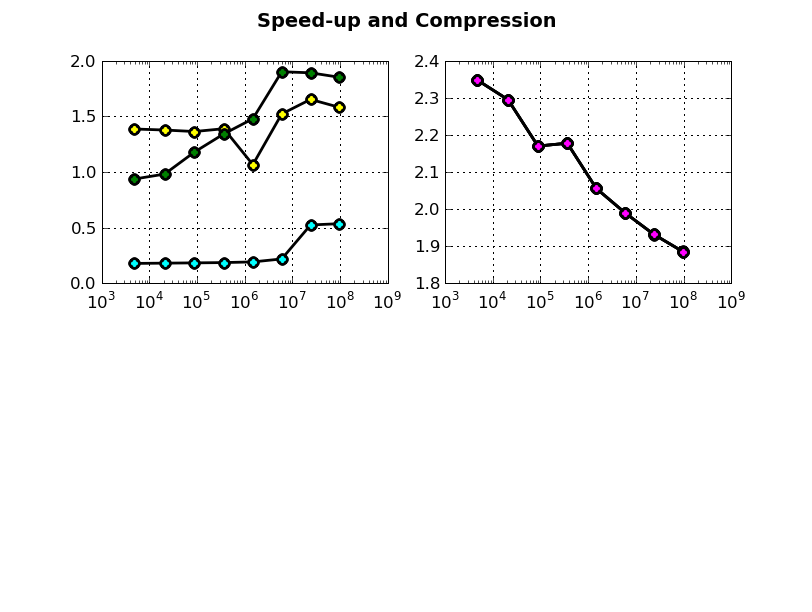
The following figure shows the speed up (left) and compression ratio (right) obtained with the Zlib geometry compressor plotted against the geometry size. The speed over three connects are shown, 1) localhost (cyan), 2) 100 MB/s (yellow) and 3) broadband (green).
Input[]
The input for the above test were a series of spheres each with a theta and phi resolution increasing by powers of two.

spheres
Compression of VTK Datasets[]
The following tables details the affects of compression on a VTK binary legacy dataset, and the runtime of a compress-decompress cycle. Three compression schemes were compared, bzip2, zlib, and szip. Three similar datasets were used for the comparison. Each was generated by an iso-surface filter applied to some simulation data. The difference between the resulting dataset is their size.
| Input Dataset | Case Number | Scheme Name | Final size | Compression Ratio | Relative Compression Ratio | Time Delta | Relative Time Delta | |
|---|---|---|---|---|---|---|---|---|
| con_05.vtk 56599161 | 1 | bzip2 | 28138744 | 2.01143 | 1.07207 | 11.2399 | 4.41872 | |
| 2 | szip-ec | 43803827 | 1.29211 | 0.688677 | 1.0916 | 0.42914 | ||
| 3 | szip-nn | 42731991 | 1.32451 | 0.705951 | 1.25058 | 0.49164 | ||
| 4 | * zlib-1 | 30166677 | 1.87621 | 1 | 2.5437 | 1 | ||
| 5 | zlib-9 | 30164110 | 1.87637 | 1.00009 | 40.2374 | 15.8185 | ||
| con_07.vtk 310901673 | 6 | bzip2 | 172528875 | 1.80203 | 1.07128 | 69.5557 | 4.62064 | |
| 7 | szip-ec | 229726730 | 1.35335 | 0.80455 | 6.03212 | 0.400718 | ||
| 8 | szip-nn | 233807043 | 1.32974 | 0.79051 | 6.91288 | 0.459228 | ||
| 9 | * zlib-1 | 184826755 | 1.68212 | 1 | 15.0533 | 1 | ||
| 10 | zlib-9 | 185721278 | 1.67402 | 0.995184 | 195.8 | 13.0072 | ||
| con_08.vtk 3073642458 | 11 | bzip2 | 1740307969 | 1.76615 | 1.05254 | 685.472 | 4.58219 | |
| 12 | szip-ec | 2476144396 | 1.2413 | 0.739754 | 59.7201 | 0.399212 | ||
| 13 | szip-nn | 2389781604 | 1.28616 | 0.766487 | 65.5272 | 0.438031 | ||
| 14 | * zlib-1 | 1831736823 | 1.67799 | 1 | 149.595 | 1 | ||
| 15 | zlib-9 | 1837988957 | 1.67229 | 0.996598 | 2017.24 | 13.4847 | ||
Input[]
The input data were isosurfaces of a test dataset at three levels. The 0.5 level produced the smallest isosurface while the value 0.8 produced a very large isosurface.


Isosurface 0.5


Isosurface 0.7